Drawing trees
If you have a tree in a file, you can draw it to your terminal by
calling interactive p4 with the -d flag:
$ p4 -d myTreeFile.phy
You can draw a tree using interactive p4 or in a p4 script:
read("myTreeFile.nex")
t = var.trees[0]
t.draw()
It also works with trees input as strings:
read("(A, B, (C, (D, E)));")
t = var.trees[0]
t.draw()
+--------1:A
|
|--------2:B
0
|        +---------4:C
+--------3
         |         +--------6:D
         +---------5
                   +--------7:E
The Tree.Tree.draw() method has a few args that you can
adjust. One odd one is the addToBrLen arg, which is 0.2 by default.
It adds that length to all branches in a text drawing to improve
legibility. Its a feature, not a bug.
Drawing a tree with TV and BTV
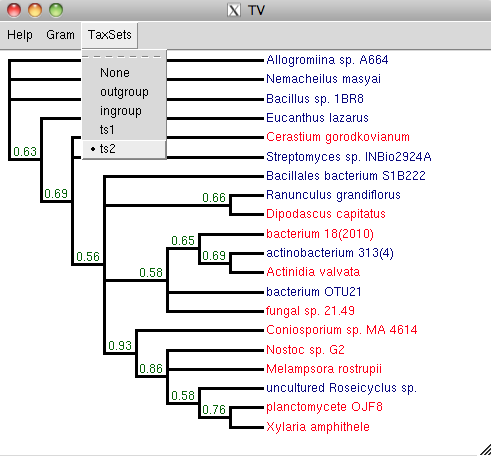
If you have Tkinter installed you can use Tree.Tree.tv() to draw
it on the screen. It uses the Python shell as the Tkinter event loop,
so you need to use this interactively.
This method understands and displays taxon sets. For example, if you
have a tree named t and you define and read in taxSets in a NEXUS
sets block like this:
#NEXUS

begin sets;
  taxSet outgroup = 1-4;
  taxSet ingroup = 5-20;
  taxSet ts1 = 1-10;
  taxSet ts2 = 11-20;
end;
Then you can:
t.setNexusSets()
t.tv()
And then you can display the taxon sets that you have defined.
If your tree is very big, it will not display well in tv(). In
that case, you can use Tree.Tree.btv() (Big Tree Viewer) to
display it. This viewer has two panels – one showing the whole tree
for navigation, and one
showing a portion of the big tree. The default colours are random,
but you can highlight taxon sets as for tv().
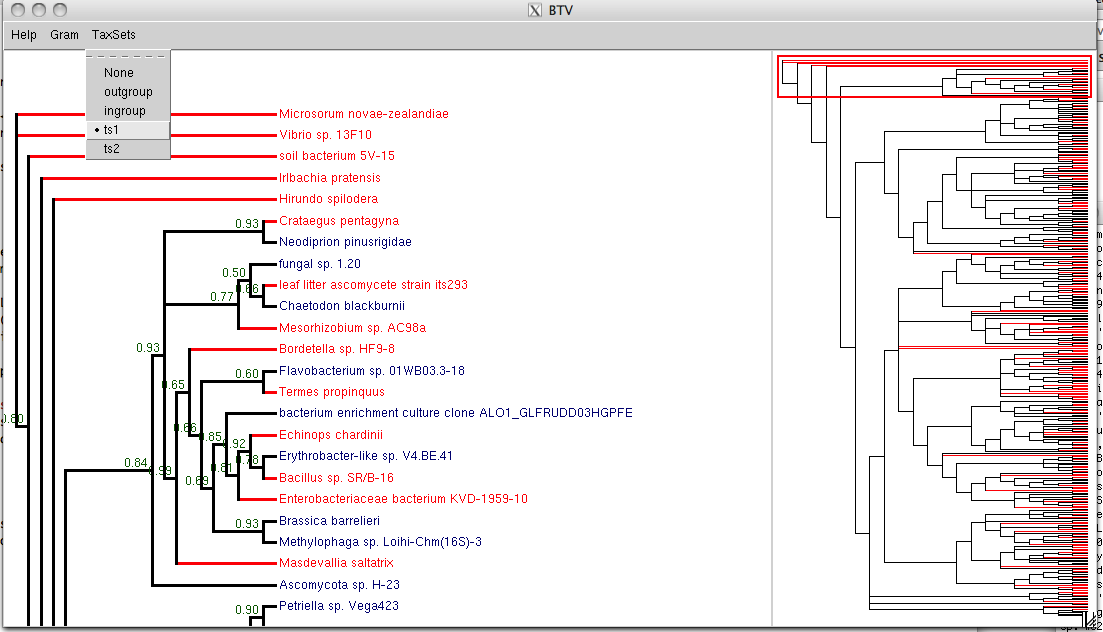
In the btv() example above, with 350 taxa, the right panel shows
the whole tree. The red rectangle in the
right panel acts as a viewport, and outlines the region of the tree that is shown in the left
panel. You can move the red rectangle up and down with the keyboard
arrow keys to change the viewport, or you can select a region with
your mouse.
You should be able to go up to a few thousand taxa with btv().
But when trees get that big, I don’t think that a picture is going to
be much help.
Comparing two trees with a GUI
Lets say that you have two similar trees (with the same taxa), that perhaps look
very different because they are rooted in different places, and due to
rotations of various internal nodes, but which may additionally have
some real differences in topology. You can visualize those
differences with the Tree.Tree.tvTopologyCompare() method.
Robinson-Foulds differences between the trees are highlighted with red
or orange lines for internal splits that differ, for example

Drawing radial phylograms
See TreeGram